
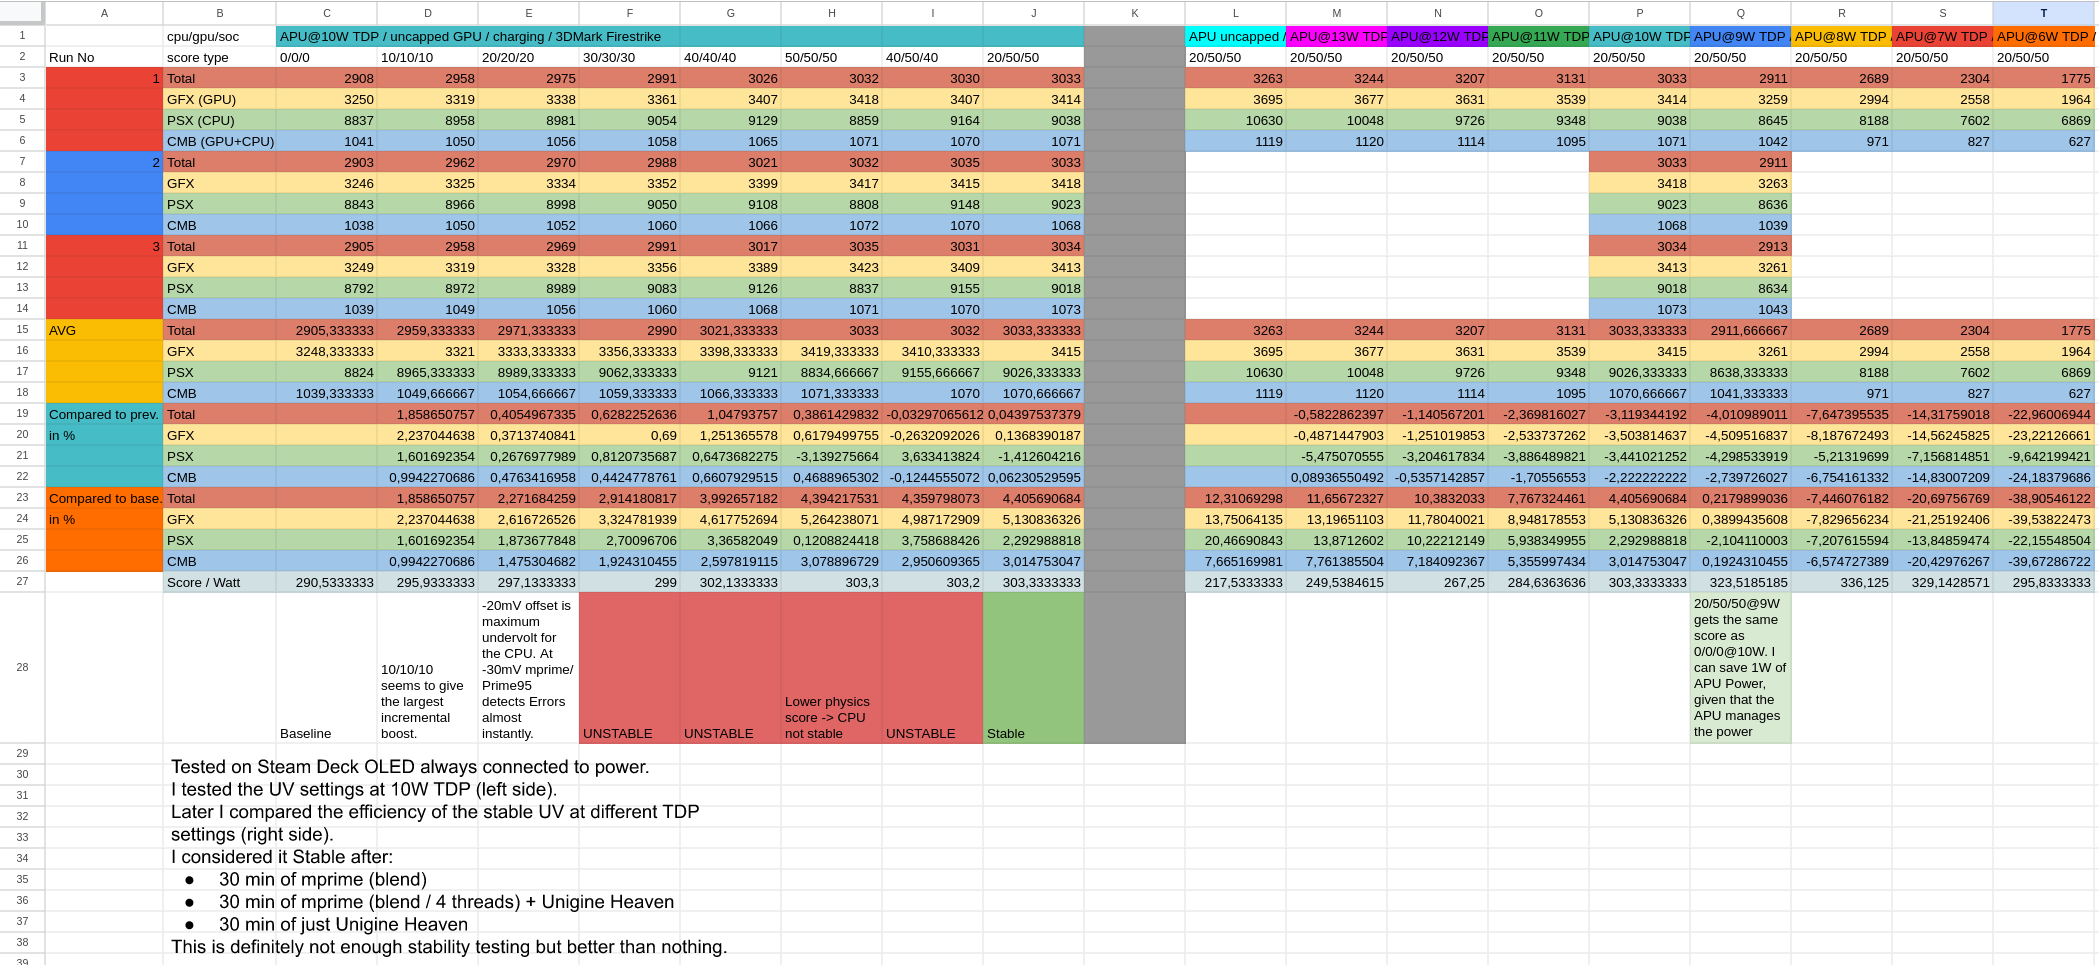
Hello, today I tested the performance and efficiency gains of my Steam Deck OLED at different TDP settings. As a benchmark i used 3DMark Firestrike. Which might not be the best benchmark for the Steam Deck, because it renders at 1080p. But you can still get good information from the results.
Link to Spreadsheet: https://docs.google.com/spreadsheets/d/1aOf00eA7WACqq1FZA1lJ067E8RFica5YpKWVEwCyB3M/edit?usp=sharing
Interesting stuff.
I’d suggest reducing the decimals (significant figures) to a more readable amount (like 1 or 2). Additionally, inconsistent number of decimals makes it harder to compare down a column. Ex: 2.23 instead of 2.23758366384763.
Agreed. The data is interesting, but that level of accuracy likely doesn’t mean anything, and it’s really hard to read. Plus, humans are really terrible at conceptualizing large numbers (even if it’s ultimately a representation of a fraction).
Accuracy may be important in calculations, but Excel will handle accuracy apart from forcing it to show only two decimal places.
Thank you for the feedback. I decreased the amount of decimals to 1 and changed the percent values to the percent format.
And thank you for accepting critique! A rare quality indeed.