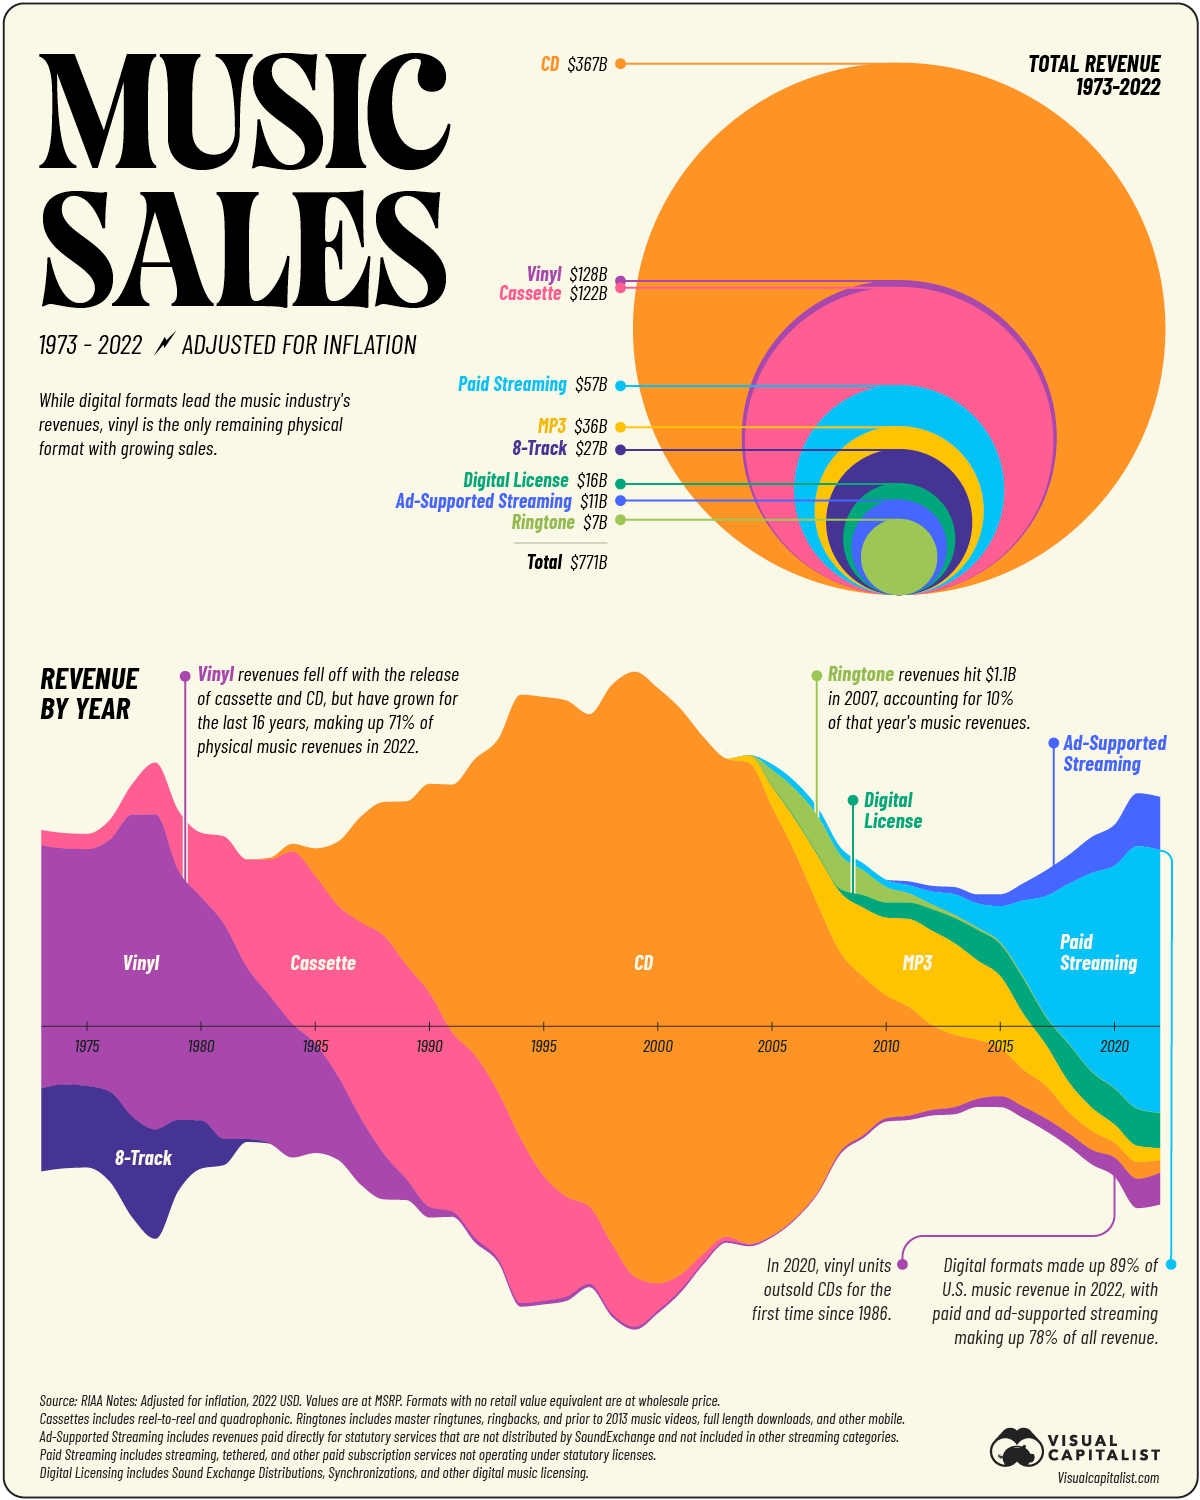
I don’t know how to but this more clearly. The distance between the top and the bottom of the coloured strip at any given year; the thickness; represents the annual revenue.
This is actually a pretty common format for representing the evolution of parts in a total, because you can clearly see the share, the combined revenue and the total revenue over the years (that’s the area). It is just that this one has been made symmetrical because it is easier to follow and just more pretty.

This is an even more confusing answer!
I don’t know how to but this more clearly. The distance between the top and the bottom of the coloured strip at any given year; the thickness; represents the annual revenue.
This is actually a pretty common format for representing the evolution of parts in a total, because you can clearly see the share, the combined revenue and the total revenue over the years (that’s the area). It is just that this one has been made symmetrical because it is easier to follow and just more pretty.