

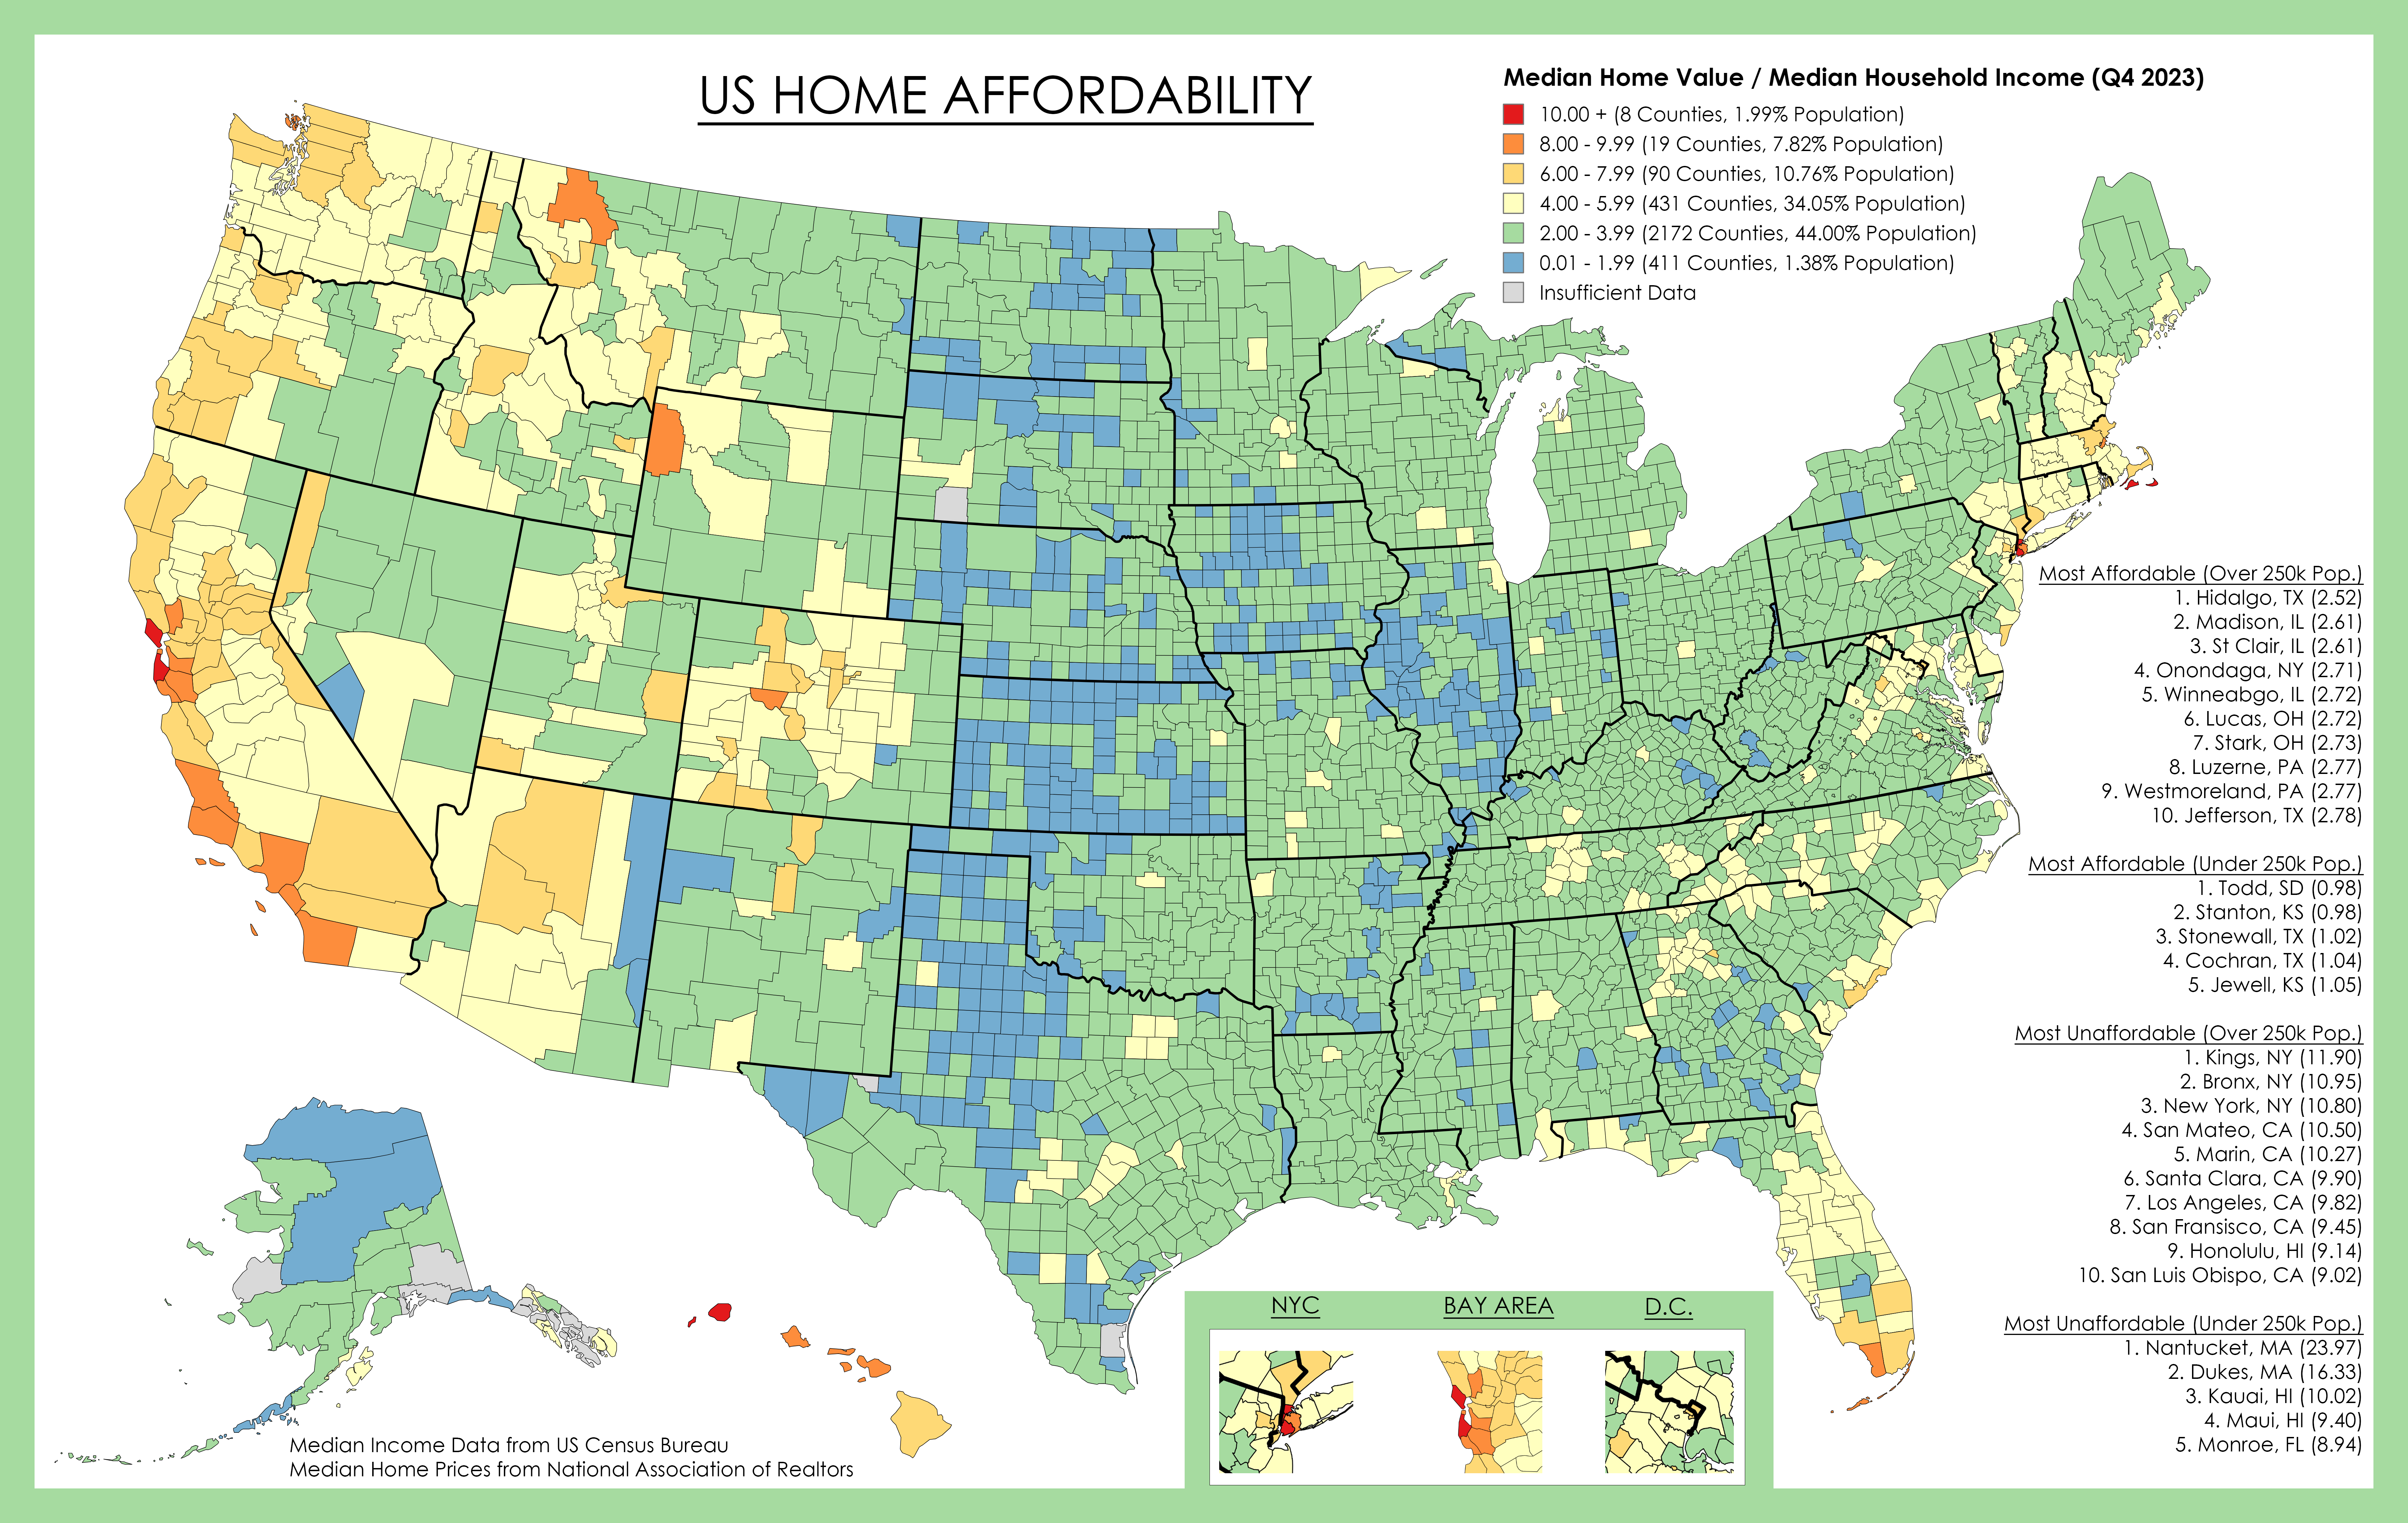
This shows county median home values divided by county median household income, both for 2023.
For example a score of “5” means the median home price in that county is 5 times the median household income in that county.
Generally, a score under 4 is considered affordable, 4-6 is pushing it, and over 6 is unaffordable for the median income.
There are of course other factors to consider such as property tax, down payment amount, assistance programs, etc. Property tax often varies at the city/township level so is impossible to accurately show.
Median Household Income Data is from US Census Bureau.
Median Home Value from National Association of Realtors, and Zillow/Redfin .
Home Values Data Link with map (missing data pulled from Zillow/Redfin/Realtor)
A few years ago I moved from a Silicon Valley 8-9 county to a Midwest 2-4 county. Something about seeing this map makes me feel good with my decision. I felt morally conflicted living in Silicon Valley where I knew most people at the stores I would shop at were struggling to afford housing. The house I was finally able to afford was about 20% of the starting price of where I lived in SFBA, and about twice the starting price of the market where I bought.
Is there any moral conflict in moving someplace cheap and outbidding all the locals with cash from selling your California house?
Not for me because that’s not what I did.