Saw this somewhere else:
For those not familiar with the stock market, this was clearly telegraphed when his media company used a SPAC.
When a company goes public (IPO), they have to file with the Securities and Exchange Commission. The process is pretty rigorous and has standard forms that you need to fill out or hurdles that you need to get over: Company financials and future growth strategy Corporate governance
Risks and issues both internal and external Lots of stuff on tech readiness, vulnerabilities and the like.
The bigger the company the harder this is to do correctly, and the more external companies you’ll need to verify and underwrite your findings. But let’s say you have a poorly structured company you want to take public. DodgyCo will never get through the IPO gauntlet, so you create a Special Purpose Acquisition Company (SPAC) called CleanCo. They have fantastic technology methodology, a strong board and TONNES of funding. CleanCo sails through all the SEC gates and Monday morning they go live on the stock market.
Monday afternoon CleanCo buys out DodgyCo, effectively making DodgyCo public without the hassle of actually having to operate like a grownup company.
This is what Trump Media Company did.
I could have sworn I just saw an article touting that Trump Media was now worth more than X though? Can someone ELI5?
Just let it fall, stop halting it. Let the market decide!
This is what really pisses me off about the stock market. It’s all free market capitalism until it goes bad then suddenly people are concerned with the knock-on effects.
They do this on the way up too. Sometimes a little breather is enough to save some pensions.
No no, too many rich people might lose money then.
deleted by creator
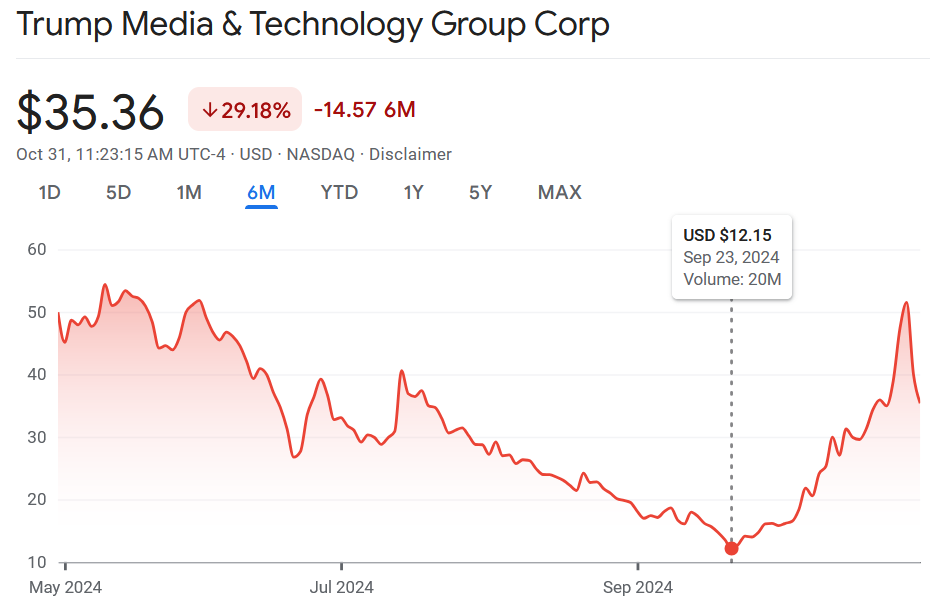
So still double what it was at the beginning of the month…
You might not feel like that looking at the graph, because:
Graphs that don’t start the y axis at 0 are shitty at conveying information
And I’ll keep complaining about them as long as people keep doing it.
Every one of these stories about DJT stock in the month of October has been missing the same subheadline. “Stock price dips to what is was at a few days ago, then quickly recovers.” Which can probably be read as “Whale cashes out, Quiltists fill in the hole.”
There’s no evidence it’s quiltists. That kind of blanket statement has no place in this debate. It could be someone else trying to fleece investors before they cotton on.
Welcome to American journalism…
Where the focus is on clicks/profits unless a billionaire bought the company to convince people billionaires aren’t the problem
Yep, no matter what it is, you know the presenter is being dishonest with information.

Rest easy now, friend. The battle is over.
And nearly triple what it was on September 23rd.

I appreciate your point and it’s a relevant one…
But did you really have to link another graph that doesn’t start at zero?
It’s funny if intentional, but my soul still died a little. It’s really become the norm in the last decade or two.
Only a little intentional :) . It was the best I could find quickly.
It drives me crazy, but it really is everywhere these days.
Like, when we printed stuff out it was a little excusable, but a couple extra pixels on a graph is never a big deal
Graphs that don’t start the y axis at 0 are shitty at conveying information
If you know how to read a graph, then it doesn’t matter if the y-axis includes zero
These are in articles for the general public. Assuming even a general understanding of graphing is not reasonable in this case.
I think completing pre-algebra (generally taught in middle school or high school) is sufficient to understand a table.
And if you can understand a table, then you can understand a graph with a y axis break.
As someone who has worked for many years in customer service and retail environments, I can conclude from your post that you haven’t worked directly with the public very much.
I think you underestimate your customers.
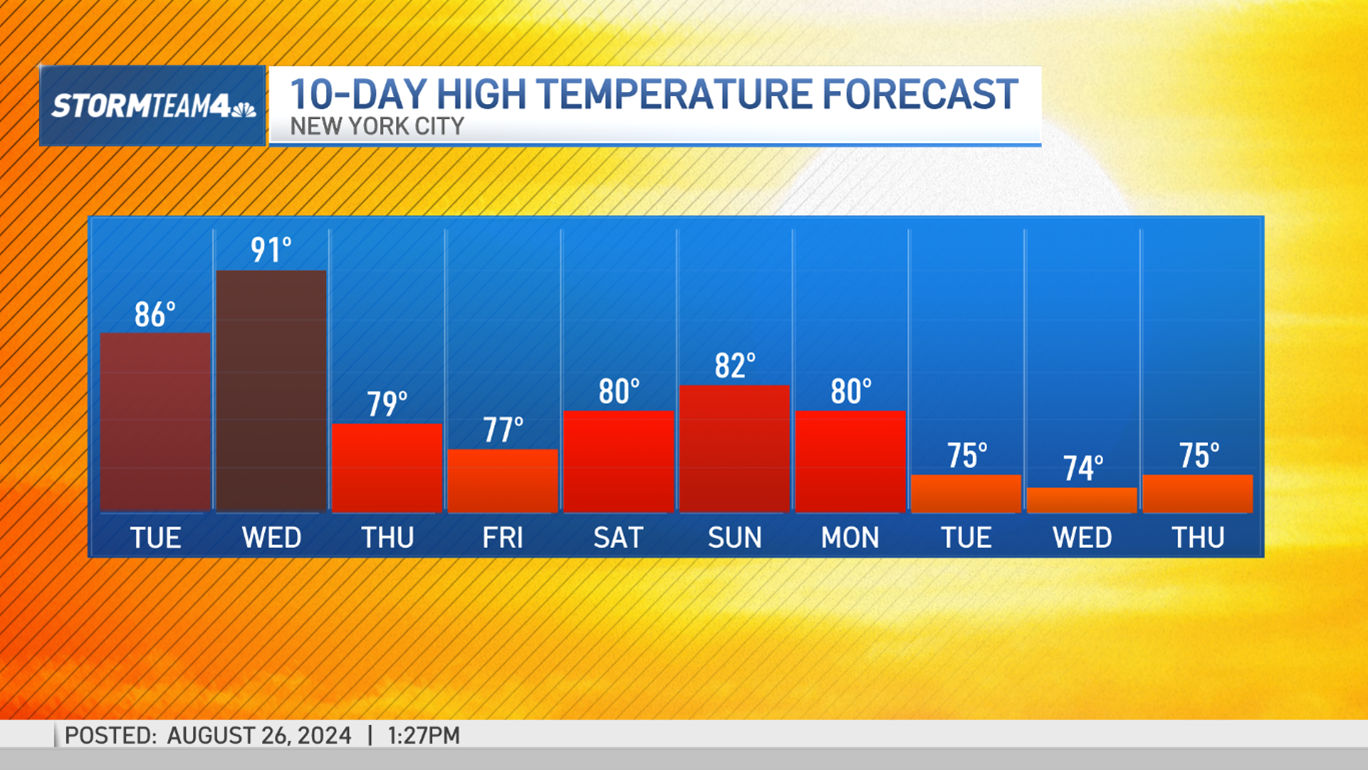
A 10 day weather forecast typically includes a graph with a y-axis break. It is meant for the general public, and most people have no difficulty interpreting it.

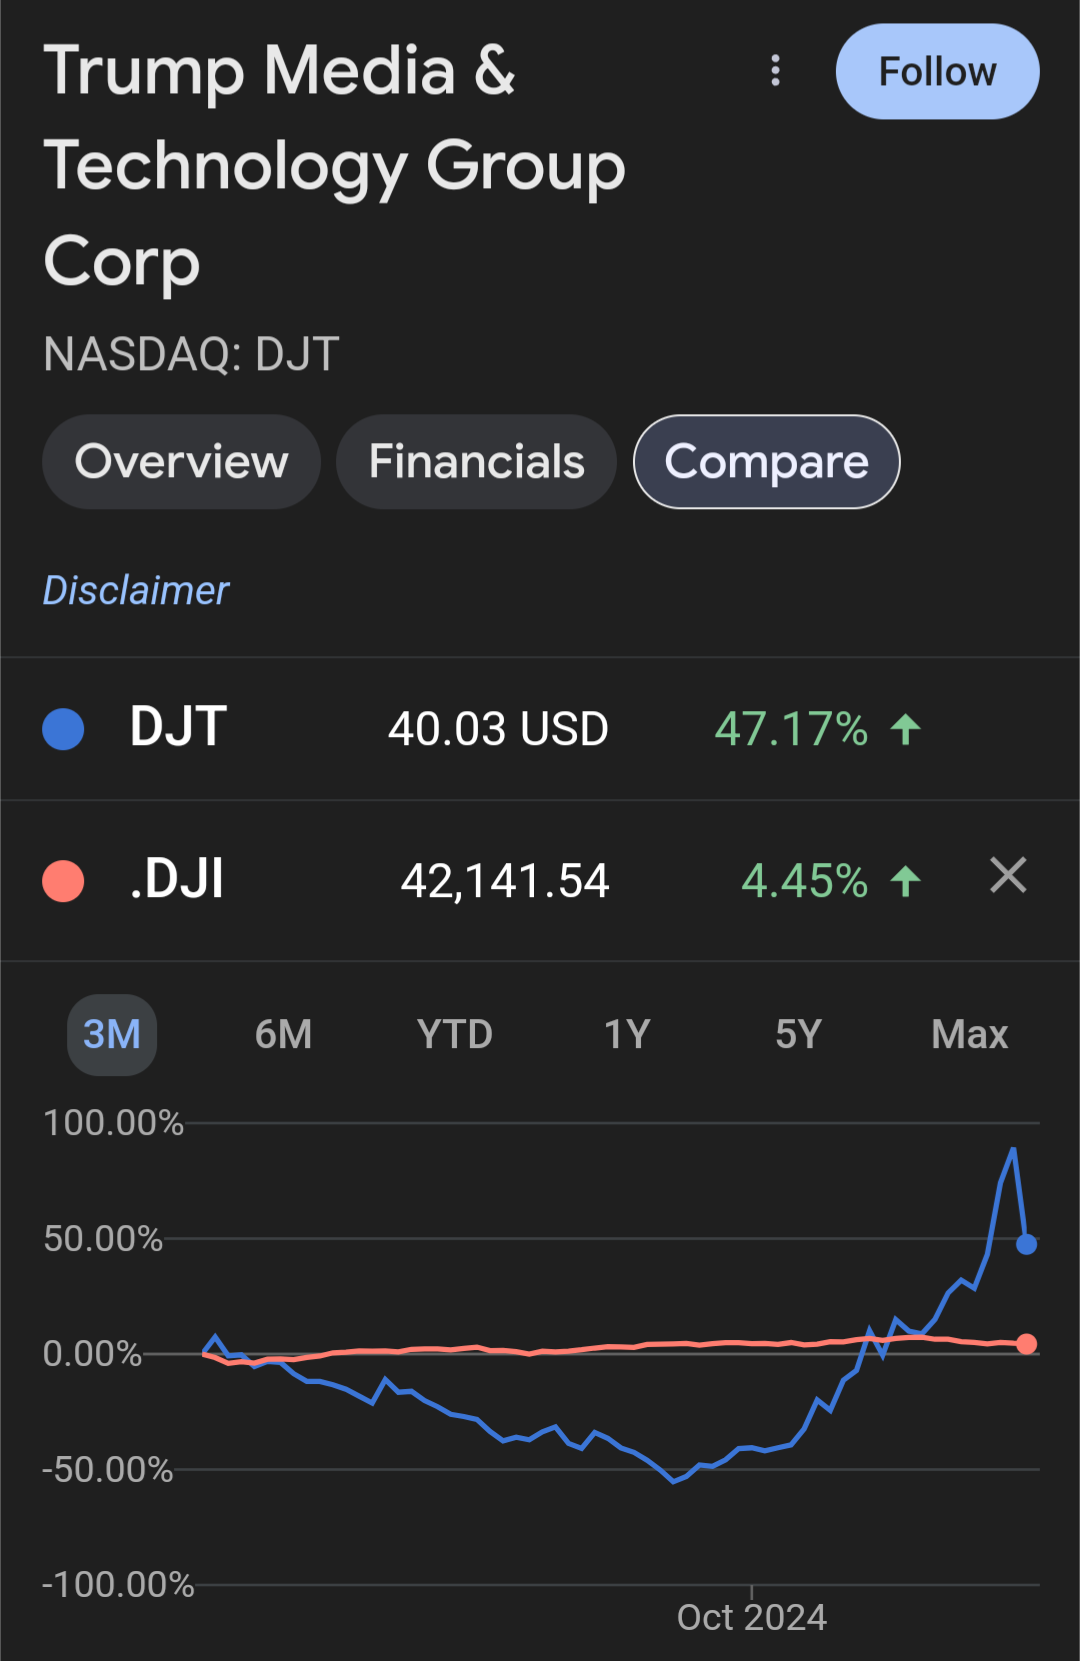
One screenshot was from the other day when it happened (cropped), the other is from today(uncropped). All I can tell is it’s a very volatile stock and people are gambling on it for short term gains.


Those are graphs of percent change…
A completely different thing…
I think the graphs demonstrate my point that compared to the S&P 500 (one of the most common indexes to compare a stock to the rest of the market) it is a very volatile stock both on the Max and 3 month comparisons. Now granted it was a quick Google search so volumes and fundamentals aren’t in there.
Then here’s the 3 month for comparison.

As soon as it’s clear Trump will not be returning to the White House, the value of the stock will plummet to near zero. There will be a few dead cat bounces, but it will go away for good once Harris is sworn in
Unfortunately, it’ll probably continue to exist as a way to launder foreign bribes to Trump. Even if Trump soundly loses, he’ll still be a useful propaganda mouthpiece.
It will be delisted.
Delisted based on…?
That stock will have value so long as Trump needs to launder money.
Yeah, but if Trump loses he becomes near worthless to anybody that is paying him. He’s not going to run in 2028. I doubt he’ll be physically able to. He’ll be abandoned (or worse) by Putin/Xi/Saudis. He’ll have his cult but his handlers will be looking for the next Trump.


