

I heard that Finland fines traffic violations in relation to income.
Maybe it does help, when fines not only hurting poor people…What are the colours in that chart actually based on?
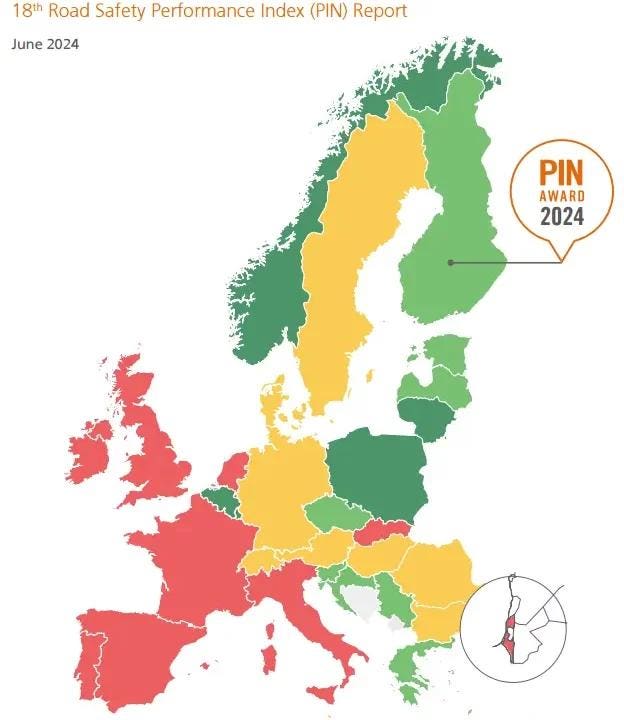
Based on that you’d think a number of countries are awful that according to the actual stats aren’t bad at all.
E.g. UK and Ireland both on 2.9 road-related deaths per 100k, among the lowest in Europe, but red (generally meaning bad) on this (unlabeled) graphic.
Germany and the Netherlands, for example, look far safer based on this graphic, but have a substantially higher death rate.
Finland has the exact same death rate as the UK and Ireland per 100k people, however has a significantly higher death rate per billion km traveled, at 5.1 versus 3.8. This is despite Finland having lower speed limits and a much lower population density.
The stats do not back up this article’s assertion at all.
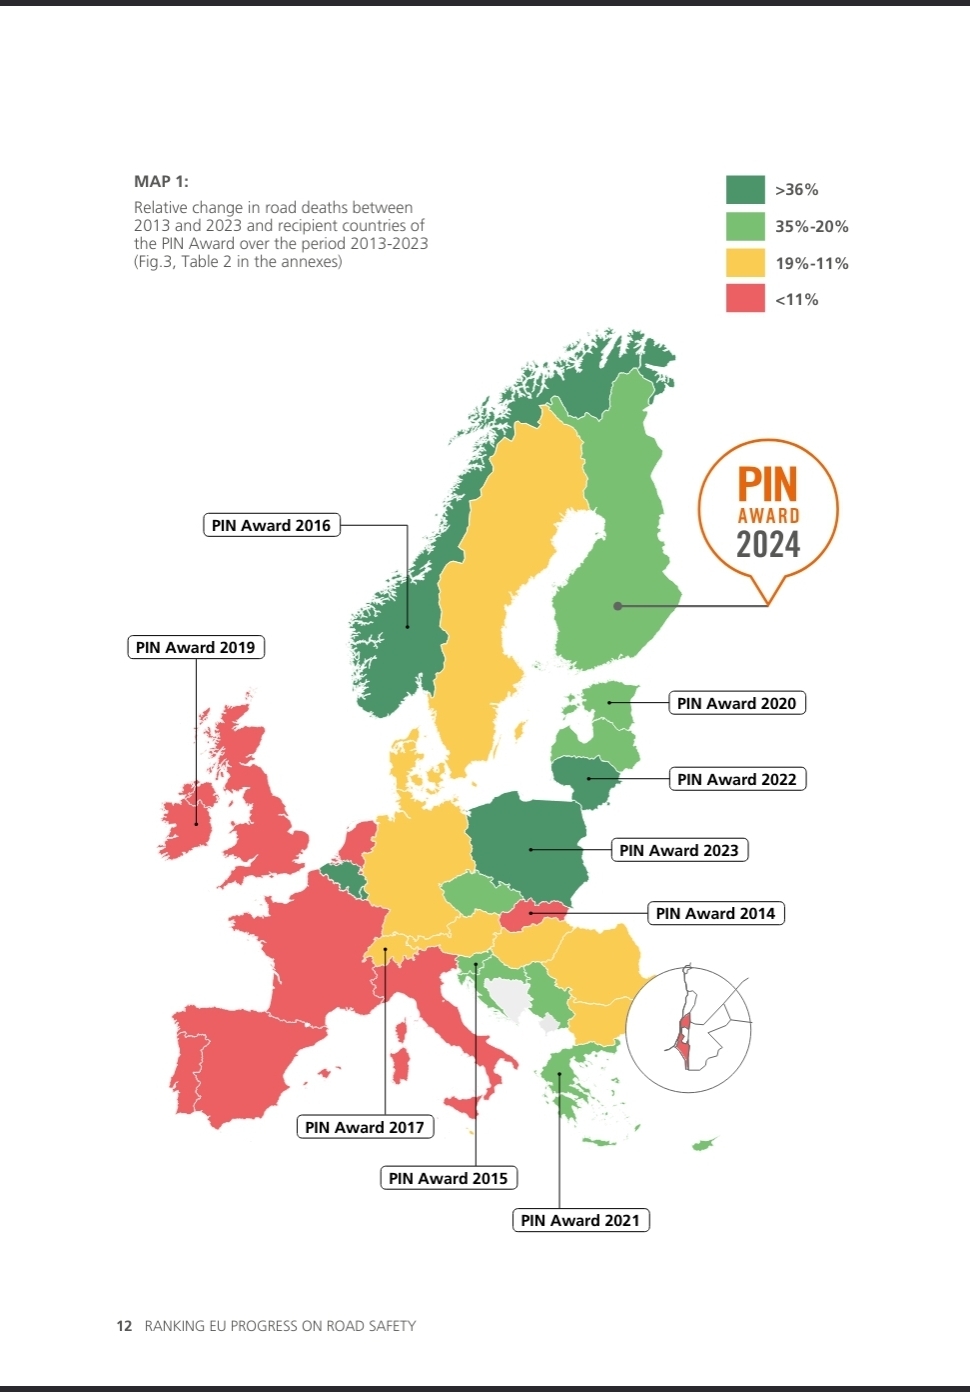
It seems to be about decrease in road deaths rather than number of road deaths. The article does eventually lead to a source. The image is in this pdf report
I didn’t read the full report and can’t tell if it’s accurate but it makes more sense seeing countries with generally worse road conditions having more growth in the last years.
Ah, this is a much better image, with an explanation that makes sense.
Skimming through their website https://etsc.eu/projects/pin/ I get the impression that it’s about awarding progress, i.e. the achievement of a reduction in death rate during the last decade, not about awarding an actually good status quo.
which, you know, is kinda sorta extremely misleading
The title of the post is misleading. The graphic itself needs context, as any graphic does.
That makes sense, thank you
These are relative improvement numbers. Red means “less than 12% reduction”. They’re not total traffic deaths in any way.
It’s also really hard to compare absolute traffic death numbers. Deaths per kilometer are influenced by country density, etc. Deaths per vehicle are skewed by multi-vehicle ownership. Deaths per person are skewed by trip length. Deaths per trip are basically unmeasured in most places.
Ideally, you’ll want to compare specific details in depth. For example: 91 cyclists died in the UK and 684 died in the Netherlands, but those numbers are meaningless if you don’t know the distance travelled and the cause of the accident. The vast majority of Dutch cycling deaths (and a very large fraction of all traffic deaths) are old people in “single-sided accidents”, for example, something that almost never happens in the UK. Does that mean the bike paths in the UK are super safe, or does it mean grandma never goes grocery shopping by bike?
Similarly, this article points out that traffic deaths per person didn’t decrease much since 2022. I’d say that’s a huge win, since the number of kilometers travelled went up hugely since a little something called covid restrictions.
I’d be willing to take bets that the typical fatal traffic accident in Finland looks a bit different than in more densely populated countries. My guess is that it’s something like “single car vs. tree on a lonely country road”, while in more densely populated countries, the involvement of multiple vehicles is more likely.
Trees don’t cross the street, mooses do.
Almost forgot about the local wildlife up there. But yes, that’s likely also a big factor. Also Avoiding to hit a moose can easily line you up for hitting a tree. (not sure what’s the lesser evil here, moose are massive and have the bulk of their body weight right at windshield height, at speed such an impact won’t end too well, just as impacting a tree) Or make you tip over your car, if it’s not built for that sort of thing. (Totally not looking at the early Mercedes A-Class)
In Denmark, it not matter how good the roads are, as it seems like 40% of drivers DNGAF about any rules. I’ve been driven off the road by a semitrailer because I did not drive above the speed limit. Weekly see people driving way above the speed limit in school sonez.
Unpopular opinion: I am so fucking tired of these assholes risking my life driving like fucking maniacs, that I hope they become stuck in a wheelchair for the rest of their life when they crash and hit a tree. Every fucking one of them.
The article is remarkably short on absolute numbers.
Finland reached 4.7 deaths per billion kilometers. The Netherlands is around 4.3 deaths per billion kilometers
For them to reduce by almost 30% to a level still 10% higher than the most densely populated country is good, but it’s shocking that it used to be SO bad.
I mean, road conditions in Finland is much worse. Harsh winters, mountains etc